lunes, 22 de noviembre de 2010

Against the idealism of carrying capacity

A population model assumes that the use of resources is equal to all of the individuals. The think here is that we are talking about “individuals” not hard numbers. They have different needs and life conditions. That’s why we cannot take the entire population of the world as in uniform conditions in order to establish the carrying capacity (K)
The individual/population resource use is a dynamic principle. We also must we aware that resources vary with time and space. Some of this variations are given by:
  • MEDCs and LEDCs
  • Urban vs. rural
  • Young communities vs. older communities
However we need to manage carrying capacity to our advantage.
It might be trough pollution control
POLLUTION MANAGEMET
Natural income –> Human activity –> wastes –>  pollution
Pollution:the addition of a substance of agent to the environment by human activity at a rate grater that that at which it can be rendered harmless by the environment.
Major sources of pollution
  • Combustion
  • Domestic waste
  • Industrial waste
  • Agricultural waste
Pollution by noise, by heat.
Sources:
  • Point source
  • Non-point source
Detection and monitoring
  • Directly. measure with a particular variable to refer an specific pollution factor. (CO2 presence in the atmosphere)
  • Indirectly. Impact. uses a variable that depends on a specific factor. (e.g. acid rain: a wide range of possibilities to measure the impact; salinity on the atmosphere)
Pollution indicators
  • Biological Oxygen Demand (BOD): amount of dissolved oxygen required to break down the organic material in a water volume through anaerobic or aerobic activity
  • Indicator species (biotic index 1-10) through invertebrates
Three-level model of pollution management.
replace, regulate and restore
Waste management

Countdown. Last three days of classes.

Just three days more, but still a lot of information to cover. Let’s ROLL

lunes, 18 de octubre de 2010

Terrestrial vs Aquatic food production systems

We have already discussed these two. Let’s continue the roll and compare directly one and another.

Terrestrial

  • First levels are more energetically efficient
  • Solar energy capture (GPP) more efficient
  • Energy transfer between trophic levels not as efficient

Aquatic

  • Food is harvested from the top trophic levels, such it lacks from energy


  • GPP is lower because of the water barrier

  • The transfer between trophic levels is most efficient.

viernes, 15 de octubre de 2010

MEDC’s vs LEDC’s food availability


Since the start of this month, we have been talking about food supply and food production. As we already know some of the general issues and concepts, we’ll now compare the specific situation that MEDC’s and LEDC’s are undergoing.

MEDC

LEDC

Cost of staple food is relatively cheap

Price fluctuation of staple food

Purchase make based on taste and preference

Purchases are made on nutritional need and affordability

Produce seasonality for mostly disappeared due to globalization

Political and economic agendas can affect food production

Average caloric content.   3314

Average caloric content.    2666

All of these differences put the LEDC’s as the more likely to suffer from malnutrition and undernutrition. This scenario is affected by distribution and politics.

miércoles, 13 de octubre de 2010

Food Production and Distribution

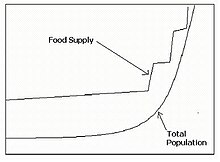
 We have already begun talking about the food supply and its unequal distribution. Now let’s discuss the issues arose by this problem and how do they are handled.


Stuff and terms that you might want to know Winking smile
Food security. This expression means that every person in a given area has a daily access to enough nutritious food to have an active and healthy life.
Food insecurity. The opposite of the first one. There are not enough food supply or simply people have not the needed resources to access them.


*This two guys are directly related to the poverty and most be treated by the government in order to secure the insecure and maintain the security.


Undernutrition. The food consumed doesn’t provides enough energy.
Malnutrition. Food has enough energy but lacks certain essential vitamins, minerals or proteins.
Overnutrition. The food consumed exceeds energy use and causes excess of body fats. Yeah… Not big deal in the LEDC’s but we need to take it into account.

Some of the essential components needed to avoid malnutrition are:

Lack of Iron: “Derives into a case of anemia (lack of iron). Increases fatigue, risk of infection and mortal danger at childbirth”. It is necessary for the hemoglobin which captures oxygen and derives it around the body.

Lack of Vitamin A.More likely to get sick or die of common infectious diseases (flu, diarrhea, measles). Blindness” - retina, thus eye-sight dependents on it Vitamins are nutrients, but a catalyzer to the absorption of nutrients.

Lack of Iodine. Affect the processes of the metabolism. It causes stunted growth, metal

Famine. A famine is a situation of severe shortage of food supply in an area accompanied by mass starvation, many deaths, economic chaos, and social disruption. It is typically generated by a catastrophic event.

*It is important to analyze famines’ impact over societies and the environment. Obviously there is a great disruption over the social structure of the community. Food becomes the main asset and its acquisition the final goal. The power if for whom has the control over the limited food supply.

The environment is harmed by the reaction of the population against the famine. People start to slaughter their livestock and grains and, instead of rationalized it, they finished up the remaining food supply.


Now that we know what’s the roll with this terms we can analyze the situation and present the actual management of the issues.

ACTUAL SCENARIO
We have already discuss the possible causes of this unequal food distribution in a previous blog entry. Let’s extended this explanation.

Our food supply is generated in both terrestrial and aquatic systems.

From the terrestrial systems we get grains and other crops, and livestock. Most of the world population’s diet is based upon wheat, rice and corn. As the income of certain sectors of the population increases, more meat and livestock's derivate products, such as milk and cheese, are consumed.

Aquatic systems generate food supply based on fish and shellfish.

It depends on the resources of each community or country which is its main source of food. But these three are the BIG THREE of food supply.

Now, the roll must go back a little bit. By talkin’ about the terrestrial systems of food production, we must take into account the different agricultural techniques that are being used…

Imbalanced Food Supply

As we have studied, human population differs a lot from all of the other organisms’ population. This is basically established because the economic model that build up our society determines the distribution of the resources. We are governed by the world’s currency and the capitalism. This, combined with the environmental conditions that make up a biome, are mostly the reason of the gap that has been established between countries in different economical levels. This gap is presented also in the FOOD SUPPLY.
It is important to establish that in fact, there IS enough food in the world BUT there is gross imbalance in its distribution. The imbalanced repartition of food supply leaves part of the people of different countries, or even inside the same country, in precarious conditions.

FOOD FACTS
  • World food production is concentrated in the northern hemisphere temperate zones.
  • There are approximately 3 chickens for every person.
  • 90% of land is not adequate for crops.
  • LEDC’s have 80%of the population but eat only 56% of the world’s meat.
In the LEDC’s where a greatest part of the population has no an appropriate access to the food supply, we can find cases of undernutrition and malnutrition
Undernourished those that do not obtain enough energy from the food they eat
Malnourished those whose food has enough energy but lacks certain essential vitamins, minerals or proteins.

Stick to the roll in order to find more about food supply. Techniques, needed measures and new concepts will be reviewed in the next posts…

miércoles, 6 de octubre de 2010

Population Pyramids

They are a useful graphic, also called age-sex pyramids, representation that give us the information to analyze population distribution and population change

Population numbers are the x-axis and age groups are on the y-axis.

*As we can see it can also be focused on only one sector of the population.

It shows:

  • How many individuals are alive in different age groups cohorts in a country or region for any given year.
  • Show the male-female ratio

Types of Pyramid Shapes.

Stage 1. Expanding – High CBR *(, rapid fall in each upward age group due to high CDR, short life expectancy.

Stage 2. Expanding – High CBR, fall in

CDR as more individuals live to the middle age, slightly life expectancy.

Stage 3. Stationary – declining CBR, low CDR, more individuals live to old age.

Stage 4. Contracting – low CBR, low CDR, higher dependency ratio (those that cannot work), longer life expectanxy

LEDC’s tend to be in stage 1 and 2, while MEDC’s are in the 3 and 4 stages.

miércoles, 29 de septiembre de 2010

Population growth and food shortages.

Thomas Malthus and Ester Boserup theories
Both theories relate food supply with population size, based on the agricultural methods used for food production.
Malthus Theory:
  • Published in “The Principle of Population” in 1798
  • It presents an approach focusing in the population size being determined by the availability of food
  • Population growth follows a geometric progression and food growth follows an arithmetic one.
  • When food supply is scarce, population size will adjust to it.
  • Food production incensement is a slow and difficult process.
  • It states that controlling population growth is easier than increasing the food supply.
Limitations:
  • The theory doesn’t present the possibility of controlling the human birth rate, but establishes a extremely pessimistic approach where organisms of the human population will just die until food supply is enough.
  • It doesn’t consider all of the changes that the industrial revolution brought.

Boserup Theory:
  • Presents a model of population in which the size determines the amount of food available.
  • When there’s stress in relation between food supply and population size, people will always find a way to increase production.
  • Workforce, machinery and fertilizers are the methods applied to increase food production.

Limitations:
  • At first, when population is low, lands are used intermittently, using fallowing (the burning of crops) to make lands more fertile. It is when population increases, that lands are used in a scheduled way. However, this requires more effort in maintaining the land.
  • The more maintenance, the more agricultural innovation, but labor increases towards farmers.
  • This tends to increase workforce but decrease crop efficiency, a process Ester calls ‘agricultural intensification’.

lunes, 27 de septiembre de 2010

Measures of Population Changes

Population change around time by the action of factors such as birth and death rate and migration.

The basic rate for measuring the fluctuations in population are the following:

Crude Birth Rate (CBR)

The number of births per 1000 individuals in a population per year.

Number of births x 1000
population size

Crude Death Rate (CDR)

The number of deaths per 1000 individuals in a population per year.

Number of deaths x 1000

population size


Natural Increase Rate

NIR = (CBR - CDR) / 10

Doesn’t consider immigration and emigration.


Doubling time

The time in years it takes a population to double its size.

Doubling time = 70 / NIR


Total Fertility Rate (TFR)

It is the average number of children that each woman has over her life time. It shows the potential of population change.

    • A TFR > 2.0 results in a population increase
    • A TFR < 2.0 results in a population decrease
    • A TFR = 2.0 results in a stable population

In developing countries, the fertility rate is usually higher than in MEDC’s


Humans impact on the environment is not just given out by its growth, but also by resource use and pollution. It’s impact is affecter by:

  • It’s affected by the amount of wealth
  • Resource desire
  • Resource need

Individuals in a population, specially in a human population, interact with the environment in different ways. We cannot generalize for all the organisms within a population.

Wait for a detailed list of identification of resource use and waste profiles in a further post.

viernes, 24 de septiembre de 2010

Human Populations Around The World

As we have talked before, the resources of Earth are unequally shared between the organisms of human population. Of course all of these is influenced by the three spheres (social, economical and environmental)

Human Development Index

Adopted by the UN Development Programme as a measure of the well-being of a country.

Combines measurements of:

  • Education
  • Life expectance
  • Standards of living
  • Income
  • GDP per capita (Gross Domestic Product)

Countries might also classified based on their industrial development and GDP

MEDCs (used by modern geographers to specifically describe the status of the countries referred to: more economically developed)

  • industrialized nations
  • rich population small poverty
  • high level of resource use per capita
  • relatively low population growth rates

LEDCs  (less economically developed)

  • less industrialized 
  • natural capital unprocessed
  • lower GDP and poverty rates
  • Large population sector with low standard of living
  • High population growth rates

jueves, 23 de septiembre de 2010

Human Population Dynamics

A very interesting topic. How much does the human population can reach? Which is our carrying capacity?

Different opinions were shared in class. Some said that we had already past our carrying capacity for more than 4 billion organisms. Others said that we are reaching it already. The odd thing was that non of us though we have too much time before we reached our carrying capacity (K)

We have to take into account that in contrast to the other species, we have created a very complex economic system that maintains our society in order and measures the “power” of each entity. This directly affect the dynamics of the our population by stating the repartition of resources and define relationship between entities.

In order to establish an equal share of resources for each organism the population would have to decrease. This is because , even if the global economic system changes its standards, there isn’t enough resources to maintain the actual 6 billion human population.

A simulation of the human population dynamics can be found in this webpage www.breathingearth.net It’s pretty interesting.

image

domingo, 19 de septiembre de 2010

Sustainable Yield in Deserts

Sustainability a wide spread term in the last decades. Economists, politicians, scientists and  businessmen are using it for everything. It is really a fashion nowadays. We must understand its real value and its real importance. A sustainable development is needed if we want to maintain the equilibrium of the world, respecting its carrying capacity. 
Sustainable yield is the the natural income that can be exploited each year without getting rid of the resources. Sustainable yield is different from one ecosystem to another. We’ll work with sustainable yield in deserts.
Specifications.
We must considered that resources in desert biomes are very scarce. The levels of precipitation are less than 15 cm a year. The diversity of desert’s flora is relatively low compared to other biomes. Contrary to the common belief the actual fauna of deserts is very rich and its concentrated in certain areas. The resources of deserts around the world differ from one and other. We can find oil and other fossil fuels in some deserts, minerals, and species richness.
In order to measure, and thus manage sustainable yield, we must establish space and time parameters. This will help us to know how much we have and how much we can use.
Useful indicators had been developed in order to maintain track of the advances in sustainable development. Some examples of this indicators can be found here, the Finland's sustainable development indicators:
  • Human Development Index
  • Greenhouse gas emissions
  • Total energy consumption
  • Use of renewable energy sources
  • Energy and natural resource consumption in relation to economic growth
  • Environmental loading in ration to economic growth
It is important to notice that not just because we are respecting the maximum sustainable yield (MSY) of a certain system, the resources will be endless. There are a lot of variations and factors that affect a system. A pretty good example of this is the chaotic situation of West Coast groundfish fishery in the United States, explained deeply here.
This is another thing in which indicators come handy and it’s the point where the management enters into the picture.
Links.
http://www.csgc.ucsd.edu/NEWSROOM/NEWSRELEASES/Carmel_Finley.html
http://www.ymparisto.fi/download.asp?contentid=92350&lan=en

viernes, 17 de septiembre de 2010

What a CLOUD!!

Another rollin' web page shared by Mr. Mendez www.wordle.net
Enter any text: blog entry, definitions, newspaper article, an essay, and keep rollin'
Be creative and find cool uses to it.
The final result a cloud with the most used words.

Example: definitions of SUSTAINABILITY shared by the class

CLOUD:
Wordle: sustainablity
Sustainability definition's cloud

lunes, 13 de septiembre de 2010

Defining Sustainability

In simple words: sustainability is to endure. To exist for a long period of time. If you ask me, sustainability is “the responsible manage of resources that work towards using them while maintaining an equilibrium.”

Introduced in an actual context.
Sustainability is a term that has gained importance in the social world’s context because the arise of concern about the actual Eath’s natural capacity to sustain human life as it is know. That’s why the concept, in means of development, has been defined as: “sustainable development is development that meets the needs of the present without compromising the ability of future generations to meet their own needs.”

As a social issue, sustainability enters in means of maintaining the resources for future generation. We must understand that for the world natural equilibrium to be maintained, we need to start taking greater conscience about damage we are making to the environment and how we are wearing down its sustainability. That’s why society and specific institutions are working to create policies for the regulation of the human activities that act against sustainability.

In an economic context. The concept of sustainable yield enters into the picture. It is the increase of natural capital. The natural income that can be exploited each year without getting rid of it. MSY (maximum sustainable yield) is based on this last idea.

It’s equal to
-(The total biomass or energy at a time) T1 – (total biomass of energy at a time) T
-Annual growth and recruitment – annual death and emigration.

A few points to achieving a sustainable way of living:
  • To control the exploitation of natural resources.
  • To look for alternative practices that help prevent a loss of equilibrium.
  • Understand the entire human society structure and the economic system as part of the global environmental system
Sustainability is involved in three different spheres. Each one of the spheres functions as an individual particle, but at the same time are affected by the others.

miércoles, 8 de septiembre de 2010

Natural BANK. Do u get the roll?

As in an economic system scheme, capital is related to all the valuable and useful resources that an entity (private company, NGO, and rollin') could have. The main purpose of an economic system is to produce and distribute (for an later consumption) of goods and services by the use of human and manufactured resources to satisfy people's needs and wants.

In contrast we have the NATURAL SYSTEMS, which have their own form of capital. NATURAL CAPITAL is as valuable than "economic capital". It gather all of the means needed to accomplish all of the ends. NATURAL CAPITAL includes
  • the natural resources that have value and those that support life
  • the natural processes that take place.


As in the economic system, NATURAL CAPITAL is also intend to produce an income.

e.x.

Photosyntesis ------------------------------> oxygen
water cycle -----------------------------> fresh water
nitrogen cycle -------------------------------> nutrients in the soil
biodiversity --------------------------------> stability, evolution, and rollin'

Natural capital might be classified in:

- renewable - replenishable
- non-renewable - recyclable

lunes, 23 de agosto de 2010

EcoGuru: Measuring ecological footprint.

This is a really ROLLING idea.
EcoGuru application provided by the WWF that estimates how many planets will be needed if all of the world's population live as you do.
If you click on the tab "Green your life style" some tips for reducing you print will be shown, check them out. Here is just a teaser:
  • Don't cool empty rooms
  • Share newspapers
  • Walk or bike
If you want to try it click here.

The WWF webpage: http://www.wwf.org/

The measuring Roll


The measurements information is used to value the state of things (good or wrong) and then act towards control the variables.

The methods for measuring biomass vary between ecosystems, biomes and type of organism.

It is important in the vegetation measurement, representing an indicator of productivity and of ecological and management processes in the vegetation.

Vegetation biomass measuring tell us what plant dominates a land by controlling the nutrients and water resources. Estimates of biomass and residual biomass also strongly influence the hydrologic properties of the site including infiltration, runoff, and erosion. Biomass of both grasses and woody plants constitute potential fuels that can be measured to assess the risk of wildfire.
Biomass can be directly measured with little training, although, it is time consuming.

The above MODIS Enhanced Vegetation Index (EVI) map above shows the density of plant growth over the entire globe. Very low values of EVI (white and brown areas) correspond to barren areas of rock, sand, or snow. Moderate values (light greens) represent shrub and grassland, while high values indicate temperate and tropical rainforests (dark greens). The MODIS EVI gives scientists a new tool for monitoring major fluctuations in vegetation and understanding how they affect, and are affected by, regional climate trends.

The biomass of a trophic level is likely to be proportional to the number of organisms and the energy found in each level. This could be graphically shown by the use of the ecological pyramid, which are graphical representations of the trophic structure of ecosystems:

martes, 17 de agosto de 2010

Biodiversity...A ROLLIN' .ppt

Just found the coolest ppt that talks about biodiversity, it's importance, the tools for measure it and all of the issue related to the biological diversity. Give it a roll and let me know what do u think.


Yeah, I know it is a .pdf, but it is in a ppt layout.

The Biodiversity Roll.

" Biodiversity is the variety of life
and its processes; and it includes the variety
of living organisms, the genetic differences
among them, and the communities and
ecosystems in which they occur.”

Biodiversity is the amount of the different species, plants and animals, that can be found within an ecosystem, biome or the entire Earth.

The biodiversity index help us to determine the amount of species in a given area. A very simple index goes as the following example:


the number of species in the area (numerator)
-----------------------------------------------------------------------
the total number of individuals in the area (denominator )
= biodiversity index

The previous example is very basic. It might be used when little information is available and the experience of the analyst is limited. In order to carry out a better measurement of biodiversity is important to don't include only the number of species, but also the abundance of each specie.
In simple terms the main two aspects are the richness and the evenness.

Richness of species affect more directly the amount of biodiversity than the evenness.

The Simpsons Diversity index covers those two. It can actually refer to any one of 3 closely related indices:
D=1-\frac{\sum_{i=1}^S n_i(n_i-1)}{N(N-1)},

where S is the number of species, N is the total percentage cover or total number of organisms and n is the percentage cover of a species or number of organisms of a species. In this form, D ranges from 1 to 0, with 1 representing infinite diversity and 0 representing no diversity.

Another widely used index is the Shannon index of diversity. It turns out to be poorer than other indices on most criteria:

pi = the proportion of individuals of species i in the sample, pi = ni/N.

IShannon = H = - Σ pi ln(pi)

The importance of these indices lies on:
  • Understanding community structure.
  • Outline odd behaviors
  • Identify the rarity and commonness of an specie within a community
References.

"How to Calculate a Biodiversity Index." American Museum of Natural Art, n.d. Web. 17 Aug 2010. .


viernes, 13 de agosto de 2010

What's a key?

In the environmental studies, a key refers to a guide for the classification of organisms based on its specific and unique characteristics.

Keys might be dichotomus or polichotomus depending of how many variables do each one use for each branch of the classification.

The use keys make easier to place each new organism in a certain area and to understand the specifications of each species and how they differ form other. It might also make reference to evolution processes that species have underwent.

miércoles, 11 de agosto de 2010

Matter keeps rolling...

Inside the ECOSYSTEMS we find some cool features. Now we'll work with each of the elements that form them.

Living organisms are presented in every ecosystem. They have seven main characteristics:

1. They have/are cells
2. They reproduce
3. Grow and develop (die)
4. Absorb and use energy and materials
5. Maintain homeostasis
6. Respond stimuli
7. They're organized

There are thousands and thousands of organisms around the world. They're classified with different schemes or keys.

Organisms within an ecosystem can be recognized as producers, consumers, and decomposers by the way they obtain matter and energy. This division brings on the trophic levels.

Energy and matter flows through these trophic levels. As it had been told, energy is not completely transfered between levels 'cause some of it is used by each organisms.

Each organism found within an ecosystem is called an individual. Individuals that share similar characteristics and can reproduce between them form can be identify as a specie. A group of organisms of the same specie form and population. When populations are found together in a given area and interact between them they form a community.

martes, 10 de agosto de 2010

Rollin' to the "ecosystems"

Now, let's talk about the ecosystem. We already know what's a system so let's analyze the word.

ECOSYSTEM

First think that comes to mind, at least for me, is nature, animals, trees, bushes, sunny skies, dry lands or rainy days. Actually with this simple idea the definition of ecosystem can be got.
An ecosystem is the relation between biotic (living components) and abiotic (non-living components) factors in an environment.

Some examples of ecosystems
- A grassland
- A forest
- A pond
- The PrepaTec Cumbres and its surroundings.

In ecosystems matter and energy goes in and out, constantly.

Energy "goes through the system" while matter "circulates around" it.


WELCOME

HEY...
Did you ever think about the environment as something irrelevant or pointless?
Did you think that the social scheme around the world isn't related to the natural aspect?

The real deal is way too different to that conception. All the actions that we, the humans, do affect directly the environment. Do you wonder why? It is because we are all part of the same SYSTEM.

A system is defined as "a group of independent but interrelated elements comprising a unified whole". In most of the systems, there exists inputs, a series of processes, which transfer and transform inputs, and outputs. In these systems the only thing that remains constant is that CHANGE IS ALWAYS present. The actions of the different elements that form a system produce a reaction to all of the other elements. The same is presented with all of the extern elements that get inside a specific system.

This blog will be updated regularly with the objective of explaining the always changing environmental systems and how does society interacts with them.

And that's the way BioRolls.